Tableau Public’s Viz of the Day (VOTD) is a great resource for anyone looking to improve their Tableau skills or to show others the potential of Tableau. But I have never found a succinct resource to explain what it is, how it can help you, how they are chosen and how you can get involved. So I decided to make this video to answer all of these questions and help the Tableau community. So the next time you need to explain what VOTD is, you can share this article or video.
Over the years I have gotten 9 VOTDs, so I like to feel I have some idea of the program. But to make sure, I had a chat with the Tableau Public team to help round out my VOTD knowledge. So if you’d like to better understand the VOTD program or help others get up to speed, keep reading.
What is it?
Tableau Public Viz of the Day is a program that showcases awesome Tableau Public vizzes every weekday on their website, Twitter and inside Tableau Desktop (Public Edition. They are looking for something that is meant to spark data conversations, showcase what’s possible in Tableau, and highlight the work in the community. It started back in 2014 so you have over 2,000 hand picked vizzes already at your finger tips!
How can it help you?
You can get a lot out of engaging with VOTD, so it’s definitely worth your time investment. Here are the 4 main benefits I’ve found:
- Inspire
First off, you don’t know what you don’t know – so being exposed to high quality and creative uses of Tableau can inspire you to see what is possible within the tool. Perfect for when you need to tackle a new challenge at work - Learn
One you find a data viz you like, you can download the Tableau workbook, open it up and see how it was created. This is a great way to learn new Tableau techniques and skills to expand your Tableau toolbox (and impress your boss at the same time) - Community
You’ll also get exposed to the people behind the VOTDs and be able to follow them on Tableau Public and social media. There are so many talented people in the Tableau Community, this is a good way to find rising stars and established data rock stars. - Recognition
Lastly, you can submit your own Tableau Public vizzes for VOTD. If you’re chosen, your work will get seen by thousands of people. It’s also a nice bit of recognition to demonstrate your talent and creativity with data vizzes – which can be super useful when interviewing for jobs
How are they chosen?
What criteria do viz of the days have in common? These are the things I’ve noticed that past Viz of the Days have, that have probably helped them get chosen.
- Timely or Topical:
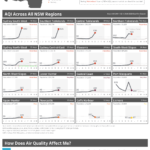 Does the viz contribute to a relatable trending or newsworthy topic from around the world? This can be holidays, elections, data pertaining to a developing news story, or topics that are trending in the BI community.
A recent example is this one, looking at the air quality in New South Wales Australia, during the bushfires - Communicates a key insight or a story:
Is there a key insight people can draw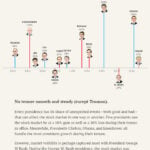 from the viz, facilitating conversation? Would this key insight be relatable for a broad audience?
See how this Viz of the Day does a great job of explaining how the stock market has fared during each US presidency - Spotlight the diverse Tableau User Community:
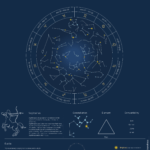
Tableau Public is for anyone, so a Viz of the Day should represent authors across industries, regions, and skill level. So no matter where you are in the world or your skill level, it seems like Tableau wants to give your talents the spotlight they deserve. Like Yuli from China’s viz or Hesham Eissa, where he got VOTD with this viz after only 6 months of using Tableau!
- Includes a novel chart type or Tableau trick:
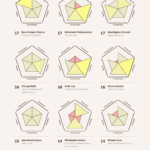 Does the viz represent a novel chart type or Tableau trick that could help unlock possibilities for other users? Has the author also written a blog post to help explain the making of his/her viz? If so, this could make it a prime candidate for Viz of the Day. Like how Samo Drole created these striking radar charts in Tableau – I didn’t even know this was possible until I saw this!
 - Highlights new features:
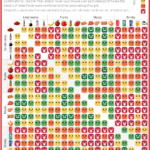 Does the viz use new product features (i.e., story points, viz in tooltip, density mark type, device designer) in a way others want to use? Like how I used Viz in Tooltips, to provide extra information for my food combination data viz, helping thousands of people learn to not put salt on their bananas…
 - Is visually stunning:
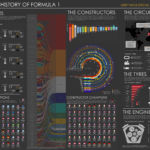 Sometimes a viz can go above and beyond the best practices of simplicity, clarity and efficiency, becoming both a data visualization and a piece of art.
Like this example that beautifully covers the history of Formula 1 racing
How to get involved
So now you know about Viz of the Day, you probably want to know how to get involved, or at the very least follow it and never miss another incredible data viz.
- Subscribe and follow:
Bookmark Tableau Public’s VOTD gallery website, to browse all of the VOTDs both old and new. They recently launched this Subscription page on their site, where you can sign up to get VOTD emails directly to your inbox. You can also follow them on Twitter at @tableaupublic or follow the #VOTD hashtag. - Submit your VOTD entries:
If you think you’ve got a Viz of the Day ready to submit or have seen a Tableau Public viz that deserves a nomination, the best way to send it to Tableau is to use this new online form they have made.
So there you go – you now know what Tableau Public Viz of the Day is, how it can help you, how they are chosen and how to get involved! If you get a viz of the day, please share it with me in the comments below. I’d love to see what you make!


