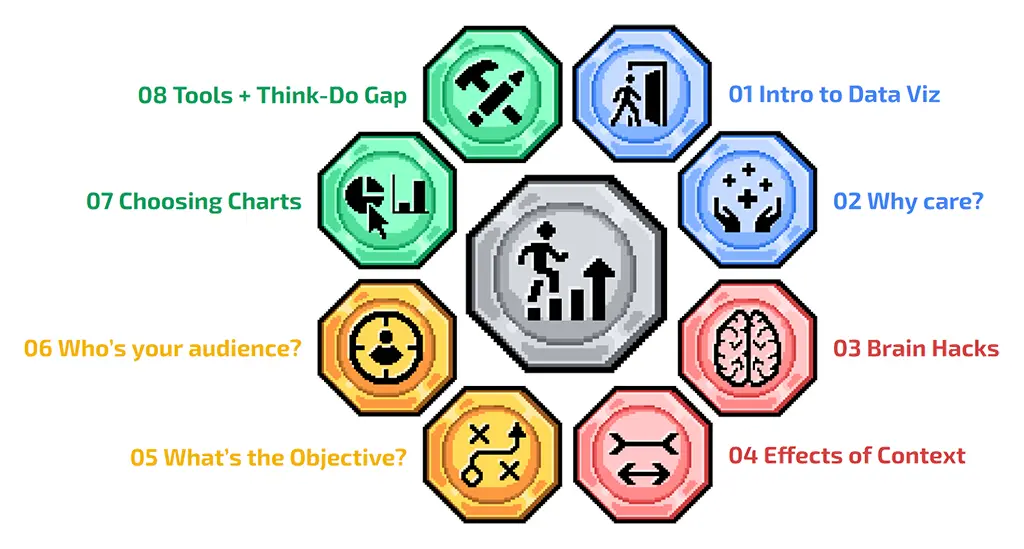
Having an appreciation of where data viz came from and how it has evolved over time into where it is today, will firmly ground what you learn throughout the course and inspire you to improve your skills.
Making charts just "look nice" is not the main goal of data visualization. In this section, you will better appreciate the tangible benefits you can provide both your audiences and yourseleves - which will help you take pride in improving your data viz game for both altruistic and/or selfish reasons.
In this section you will see how the human brain developed software to visually spot patterns to survive, that is hard coded into all of us. Then you will learn some common techniques to leverage this, to help your audience see what you want them to see at the right time - critical to data driven storytelling
In the previous section, we saw how the human brain has evolved to spot visual patterns. In this section we learn that it takes some shortcuts to achieve this, which can lead to the brain getting easily confused visually. With that in mind, you can then learn to avoid them.
Here we start to think more critically about what we put on the page, know when to stop building or enhancing a viz and be confident in succeeding to make a good data viz.
Carrying on the strategic block of the course, we focus on having empathy for your target audience. To really think about what would resonate with them best when presenting your insights and bake this awareness into your data viz workflows
This section helps you to learn some general rules and techniques to know which charts work better in certain situations. Whilst data visualization is very subjective with no definitively "correct" answers, learning some data visualization "rules of thumb" to help steer your design choices is never a bad thing - especially if you don't know where to start!
In this section you will be exposed to some of the most common data visualization tools in the market, helping you decide where you want to deep dive next. You'll also learn that the tool itself matters far less compared to what you are most comfortable in using - the less process friction you have to implement good data viz best practice the better.
Having an appreciation of where data viz came from and how it has evolved over time into where it is today, will firmly ground what you learn throughout the course and inspire you to improve your skills.
Making charts just "look nice" is not the main goal of data visualization. In this section, you will better appreciate the tangible benefits you can provide both your audiences and yourseleves - which will help you take pride in improving your data viz game for both altruistic and/or selfish reasons.
in this section you will see how the human brain developed software to visually spot patterns to survive, that is hard coded into all of us. Then you will learn some common techniques to leverage this, to help your audience see what you want them to see at the right time - critical to data driven storytelling
In the previous section, we saw how the human brain has evolved to spot visual patterns. In this section we learn that it takes some shortcuts to achieve this, which can lead to the brain getting easily confused visually. With that in mind, you can then learn to avoid them.
Here we start to think more critically about what we put on the page, know when to stop building or enhancing a viz and be confident in succeeding to make a good data viz.
Carrying on the strategic block of the course, we focus on having empathy for your target audience. To really think about what would resonate with them best when presenting your insights and bake this awareness into your data viz workflows
This section helps you to learn some general rules and techniques to know which charts work better in certain situations. Whilst data visualization is very subjective with no definitively "correct" answers, learning some data visualization "rules of thumb" to help steer your design choices is never a bad thing - especially if you don't know where to start!
In this section you will be exposed to some of the most common data visualization tools in the market, helping you decide where you want to deep dive next. You'll also learn that the tool itself matters far less compared to what you are most comfortable in using - the less process friction you have to implement good data viz best practice the better.