Most people analyse and interact with data in two ways:
- Directly, using tools like Tableau, Excel or SQL
- Via an analyst
They both share a common theme; asking questions of the data. This will in turn lead to more insightful questions being asked which ultimately leads to actionable insights that the question asker can act upon. The faster you can shorten this question/answer insights cycle, the more value you extract from the data (link to yt). This is why I am a big fan of Tableau, as it reduces this question/answer cycle down to the point where I use the analogy that you can “have a conversation with the data”.
Now, the new Ask Data feature in Tableau 2019.1 literally let’s you have a conversation with your data! It uses natural language processing to allow people to get insights by simply conversing with their data. Modalities such as natural language will help lower the barrier to analytics and unearth the next generation of self-service analytics. With Ask Data, you can ask questions of any published data source and get answers in the form of a visualization. It allows you the ability to explore data at the speed of thought!
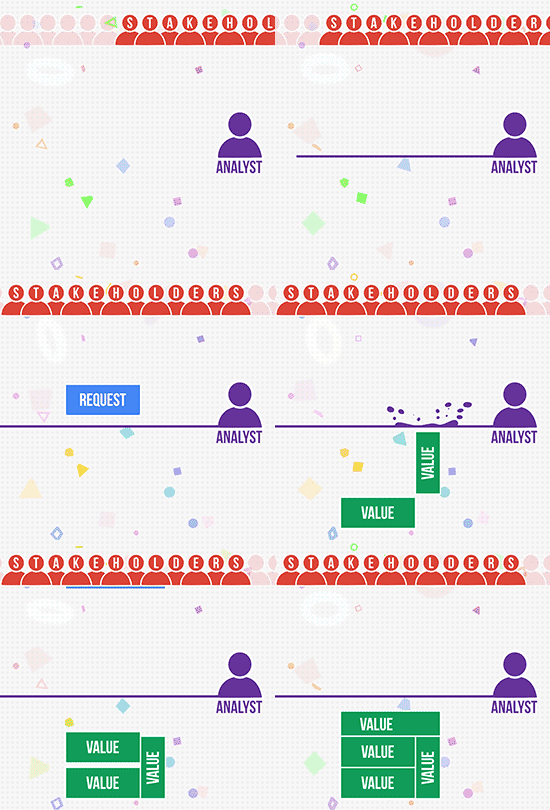
As an analyst, I’m very excited about the potential Tableau’s Ask Data can bring. A major bottleneck to a lot of companies analysis is the bandwidth of their analysts. They get a lot of small analysis requests, which can add up and they tend to deprioritize them above the higher priority requests. This isn’t to say the small requests are unimportant, but when there is a finite resource (analyst time) these requests can fall by the wayside.
 But with Ask Data, this analyst bandwidth problem goes away – as it empowers the analysis requester to answer their own questions.
Check out the video at the top of this post to see me using Ask Data – I’ll ask questions of the data, and Tableau will create data visualisations to answer them. I’ll also have the ability to save the ones I like and even modify them manually if needed. Try the free demo for yourself to get familiar with this awesome new feature.
It’s an amazing first step into this field by Tableau, and demonstrates their commitment to enhancing the data analysis and visualisation space. I’m excited to see how this feature evolves and develops, and will definitely report back on any new things that come about.
Have you used Ask Data yet? What are you most excited about? How do you see this benefiting you and your company? Let me know in the comments below.


