Free Resume Template + Data Viz = Win
Data visualization does not only to apply to quantitative data. You can also apply lots of data visualisation techniques to qualitative data too.That’s what I
Datasaurus-Rex
- making Data Visualization
Fun Accessible Engaging

Welcome to the Datasaurus-Rex website, where we aim to make data visualisation fun, accessible and engaging.
The site is broken downs into two main sections. You can either Learn some useful things about data visualization to help you improve your skills or be Inspired by the data viz community and see what is possible, beyond the defaults of your spreadsheet tools.
Use the buttons above or the navigation bar at the top to start your data visualization journey today!
Welcome to the Datasaurus-Rex website, where we aim to make data visualisation fun, accessible and engaging!

Data visualization does not only to apply to quantitative data. You can also apply lots of data visualisation techniques to qualitative data too.That’s what I

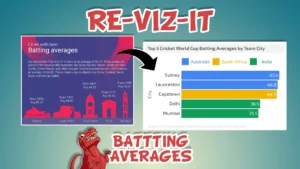
In today’s Re-Viz-It we’ll be looking at an ESPN data viz focusing on the Batting Averages of the top Cricket teams from around the world. The purpose is

Problem Data Puking Have you ever created or experienced a slide, email or data visualization that is so dense and complicated, that you cannot work

At the start of the pandemic I wrote a Livestream setup and best practices guide in Google Docs. This was to help others learn from

In this post we’ll see how a super helpful reddit community and the power of data visualization helped me solve a big problem; finding the

Context: doing groceries sucks… … but it doesn’t have to. My wife and I are going to be first time parents soon and I wanted

Data visualization does not only to apply to quantitative data. You can also apply lots of data visualisation techniques to qualitative data too.That’s what I

In today’s Re-Viz-It we’ll be looking at an ESPN data viz focusing on the Batting Averages of the top Cricket teams from around the world. The purpose is

Problem Data Puking Have you ever created or experienced a slide, email or data visualization that is so dense and complicated, that you cannot work

At the start of the pandemic I wrote a Livestream setup and best practices guide in Google Docs. This was to help others learn from

In this post we’ll see how a super helpful reddit community and the power of data visualization helped me solve a big problem; finding the

Context: doing groceries sucks… … but it doesn’t have to. My wife and I are going to be first time parents soon and I wanted

Sign up to The Rawr newsletter to stay up to date on new content from the site and YouTube channel.

Sign up to The Rawr newsletter to stay up to date on new content from the site and YouTube channel.