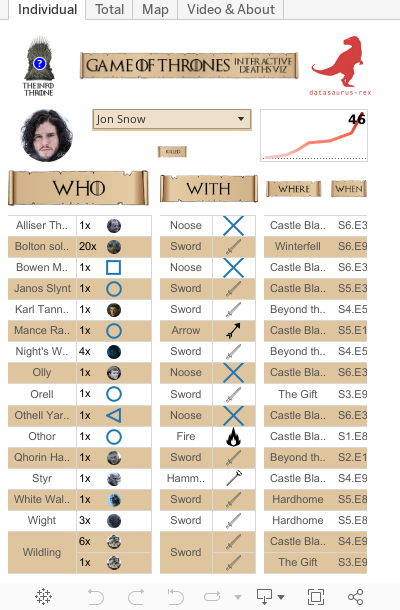
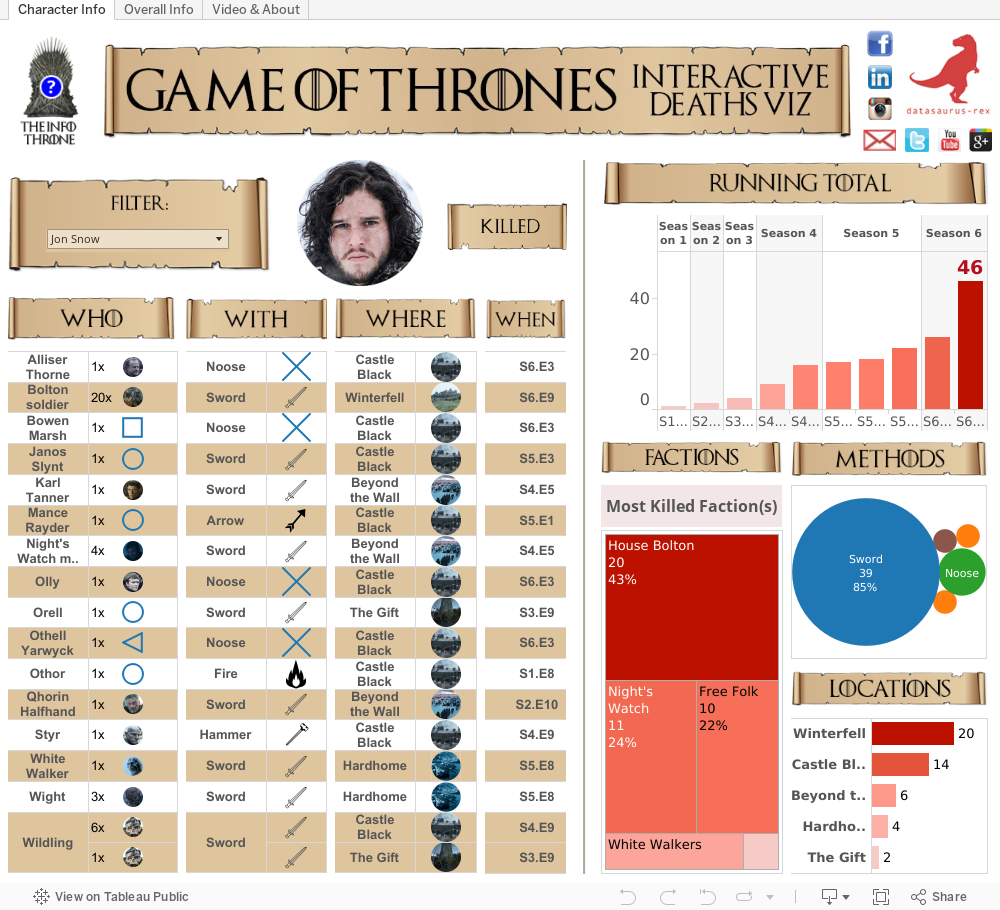
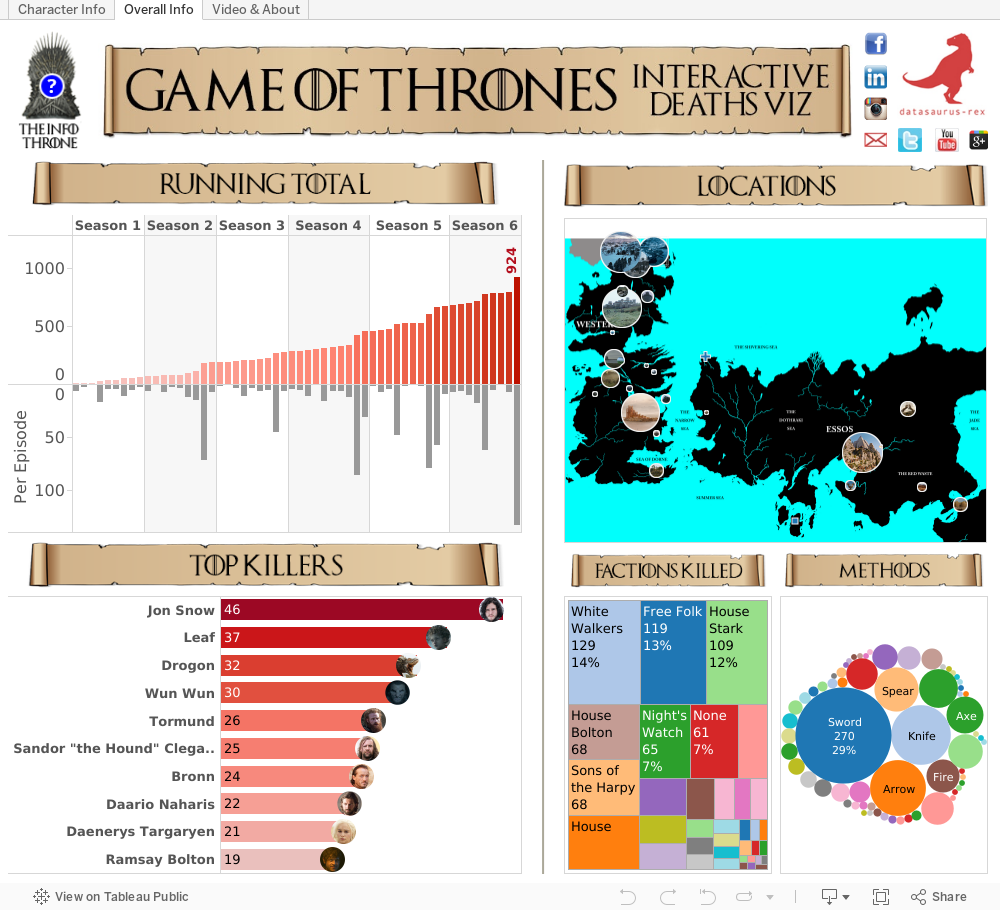
Game of Thrones is back and so is my interactive data viz (below)! It’s been completely overhauled since last year to better help you find interesting insights for individual characters such as who killed who, with what, where and when. Or see the overall stats for the show, such as the running kill total (it’s nearing 700!).
Check out each tab and hover over The Info Throne for instructions on how to fully interact with the visualization. If you have issues viewing it, click here. Be sure to check back each week as I update the data as soon as the episode airs. Updated to Season 6, Episode 4.
#WARNING: Spoilers are below#


12 Responses
Very interesting! In what way is a noose different to a the death methods of hanging or rope?
Good point – semantic variety and a bad memory of what I labelled things before are to blame for this one. I’ll update it soon, thanks!
How/where did you get data? If you are using raw text data from the books or the raw video data (and/or scripts) from the episodes, how did you preprocess such raw data into structured data? Thanks!
It’s manually compiled by me i.e. I watch an episode and every time there is a death I pause it and enter the details into a Google Sheet.
If you’re up to speed on the show, you can see why I’ve taken a break after watching the last episode of Season 6… :)
Is it possible to set each of the worksheets as “Use as Filter” to determine for example where, who, and when the 40 people were killed with axes? It appears the “Running Total” worksheet is set as a filter, but each of the others just highlights and allows for “Keep Only”.
How do we import the character images in the tableau worksheet for visualisation…???
can i get a help in it..
You’ll have to find images for each character and put them in to your viz. It’s easy to do with lots of free software out there. The other fiddly thing is to then match each image to the character in the Icon page of Tableau – I couldn’t find a way to speed that part of the process up, but if you find a way, let us all know!