After making an interactive infographic using data from the Game Grumps YouTube channel, I decided to go deeper into the data and analyse it, create some insights and convey them in a short video. My remit was ‘fun and engaging’, as topics with data can get very dry very quickly. So I tried to keep things interesting by keeping the visualizations varied and the insights short. Let me know what you think and I’m aiming to make a few more smaller videos on this data in a new series I’ll be calling minsights :)

Game Grumps Channel Analysis Video
Home » Inspiration » Storytelling » Game Grumps Channel Analysis Video
Home » Inspiration » Storytelling » Game Grumps Channel Analysis Video
Table of Contents
Social Media:
Most Popular:

Free Resume Template + Data Viz = Win
January 26, 2023
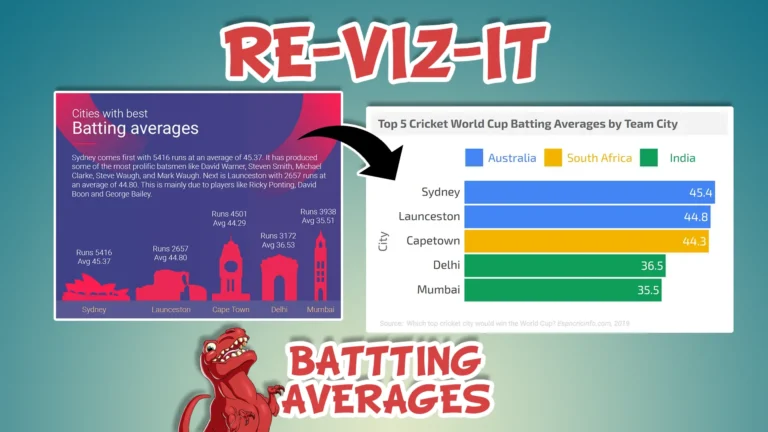
Re-Viz-It | Batting Averages
October 17, 2022
Data Puking (and How To Avoid It)
August 31, 2022
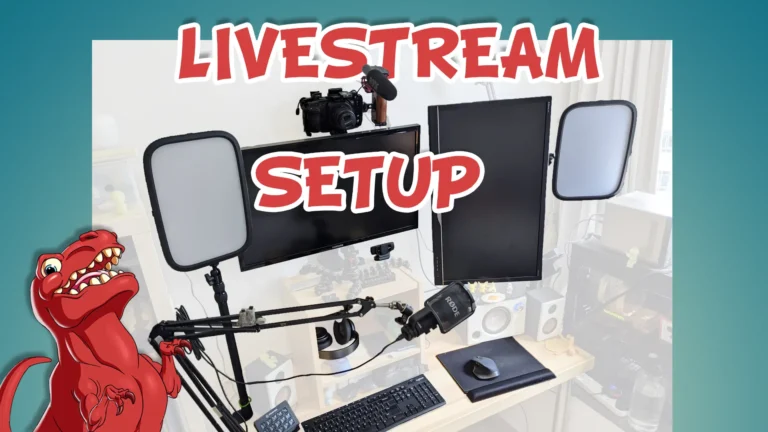
Livestream Setup & Best Practices Guide
August 26, 2022
Related Posts
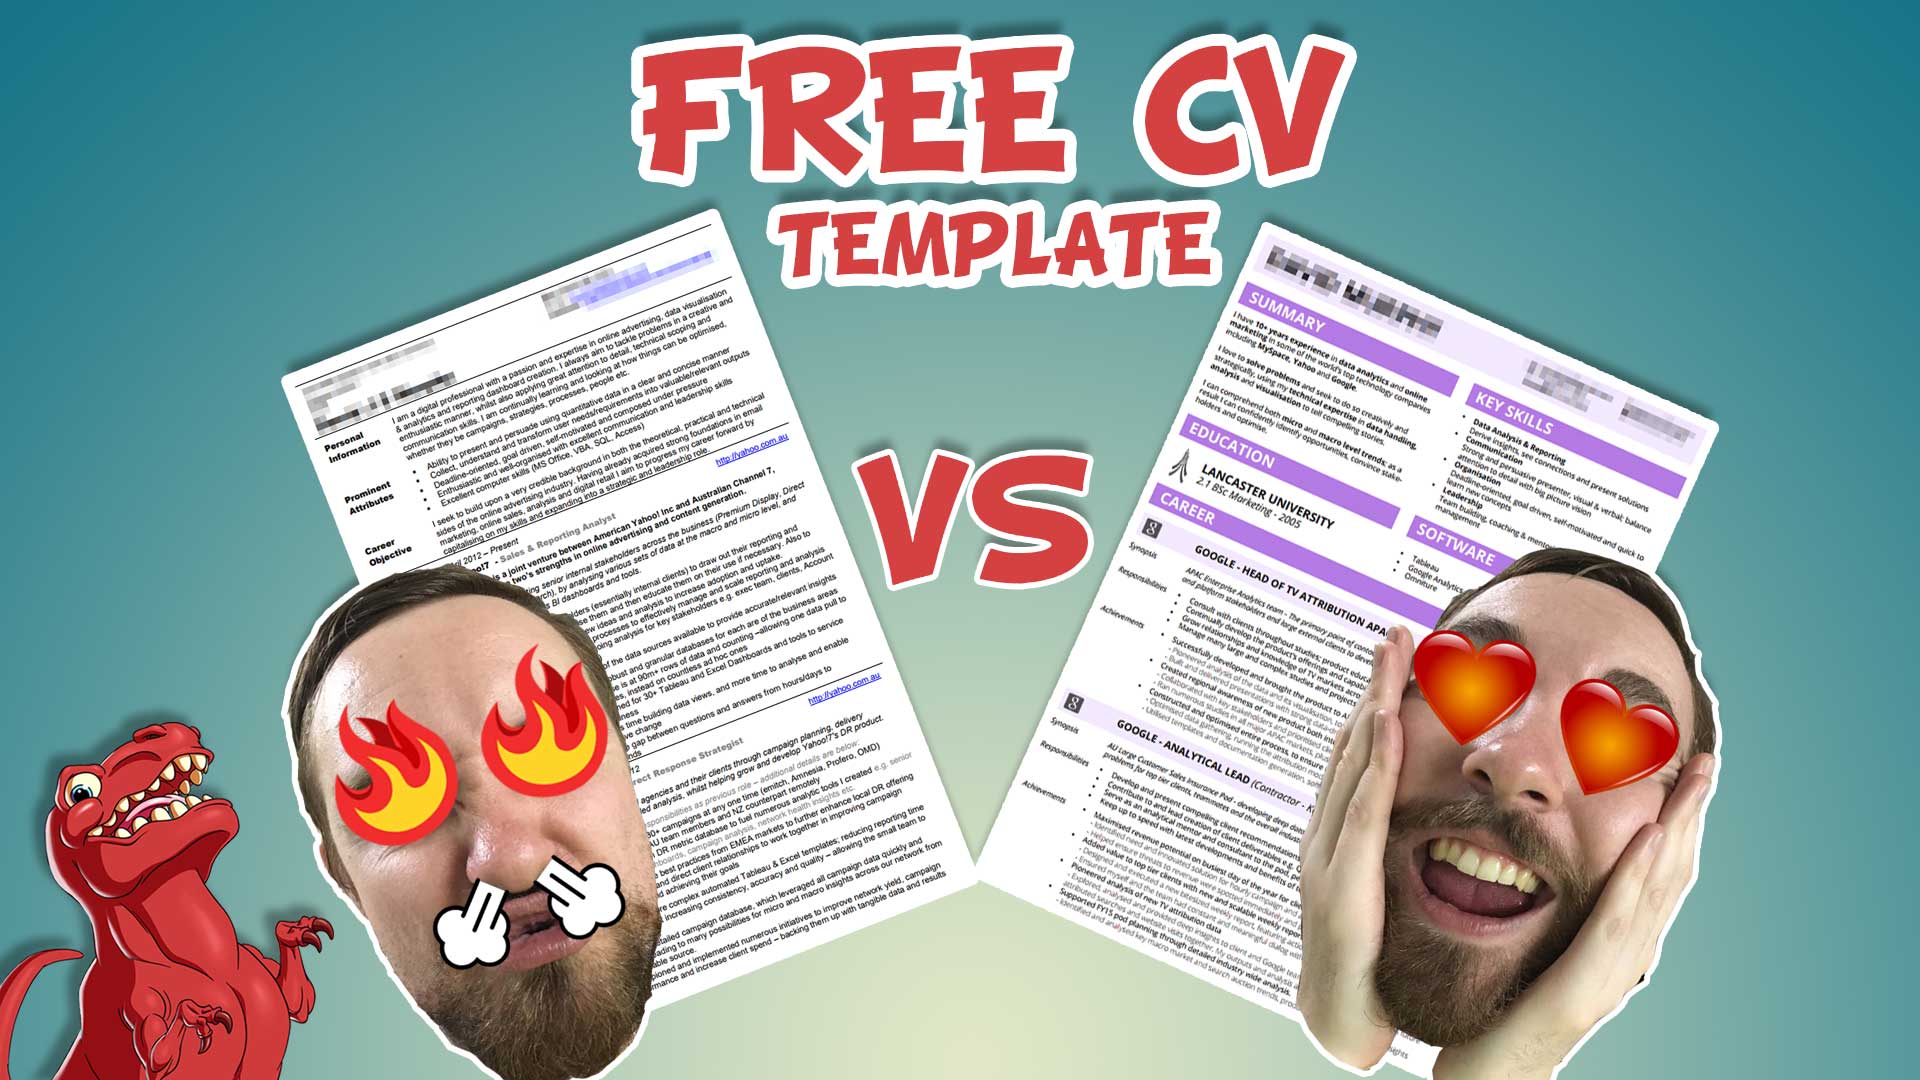
Free Resume Template + Data Viz = Win
Data visualization does not only to apply to quantitative data. You can also apply lots of data visualisation techniques to qualitative data too.That’s what I
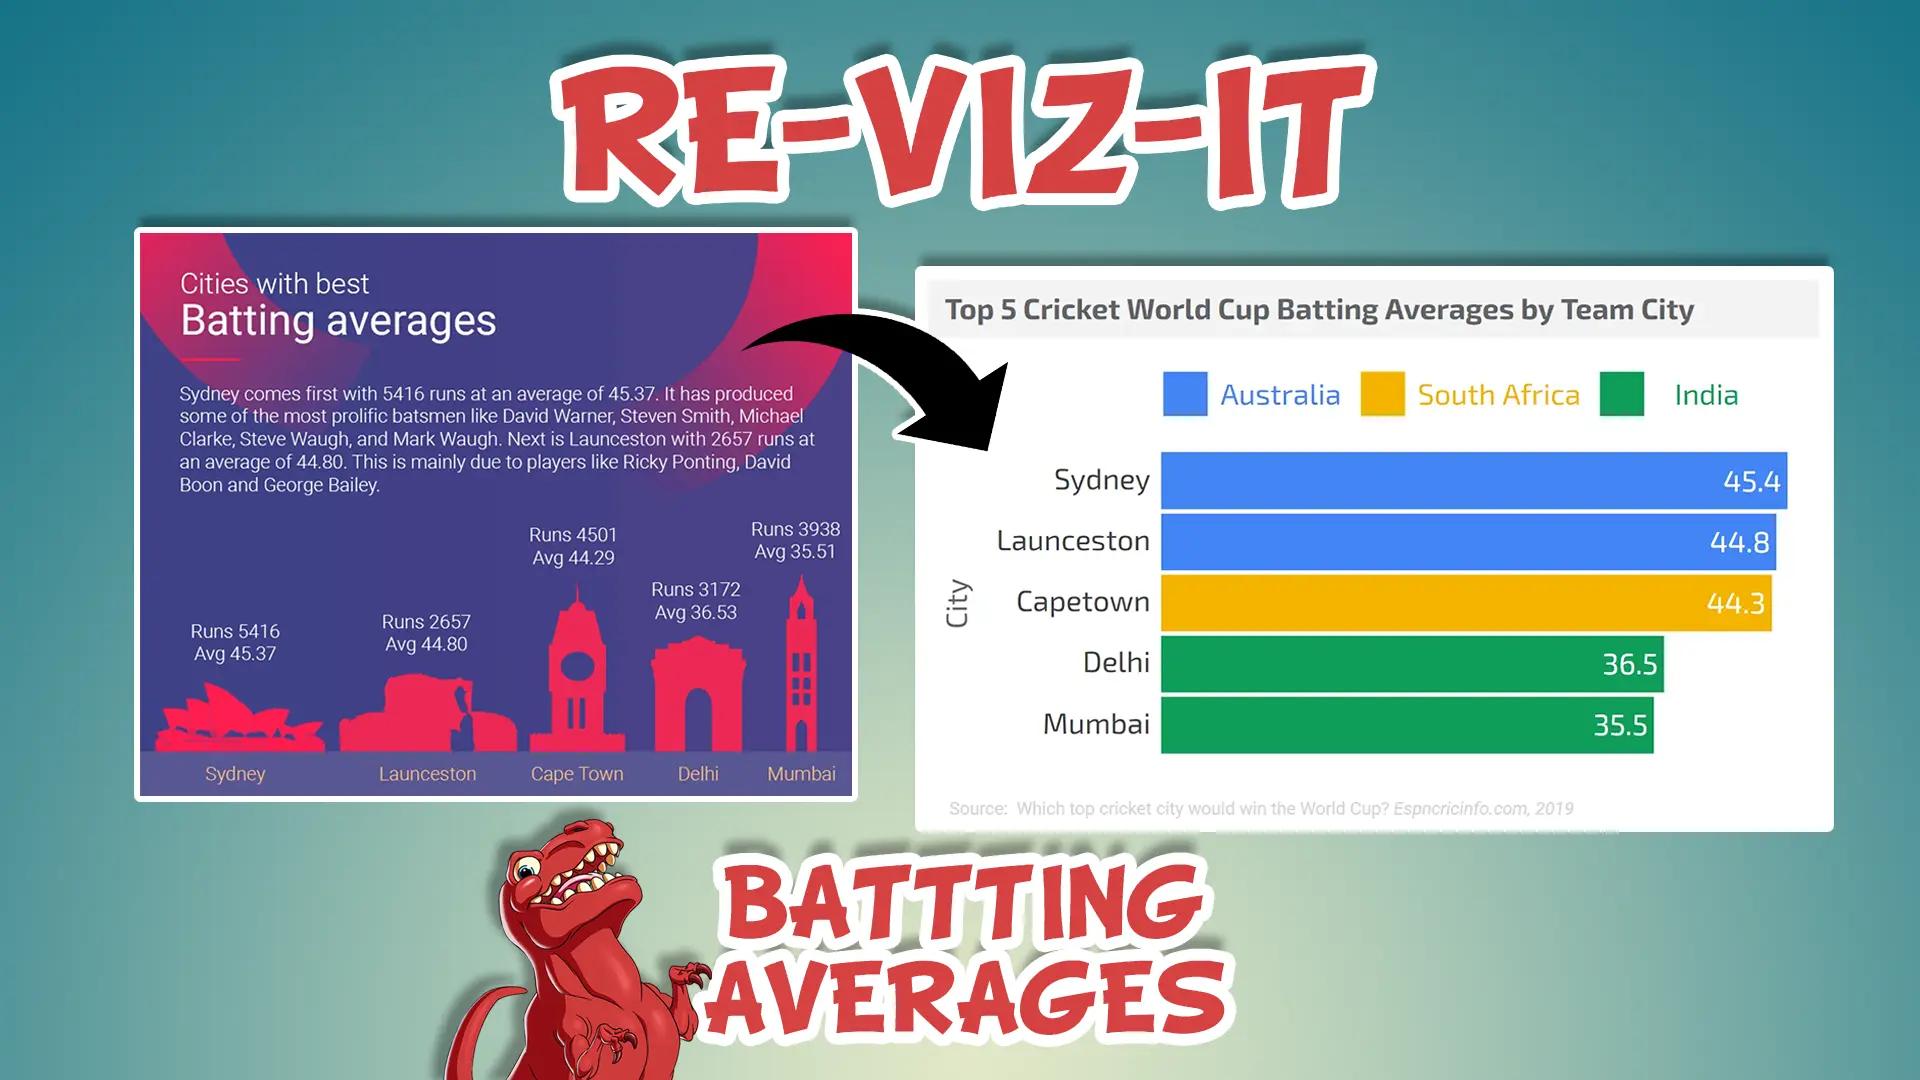
Re-Viz-It | Batting Averages
In today’s Re-Viz-It we’ll be looking at an ESPN data viz focusing on the Batting Averages of the top Cricket teams from around the world. The purpose is
Data Puking (and How To Avoid It)
Problem Data Puking Have you ever created or experienced a slide, email or data visualization that is so dense and complicated, that you cannot work
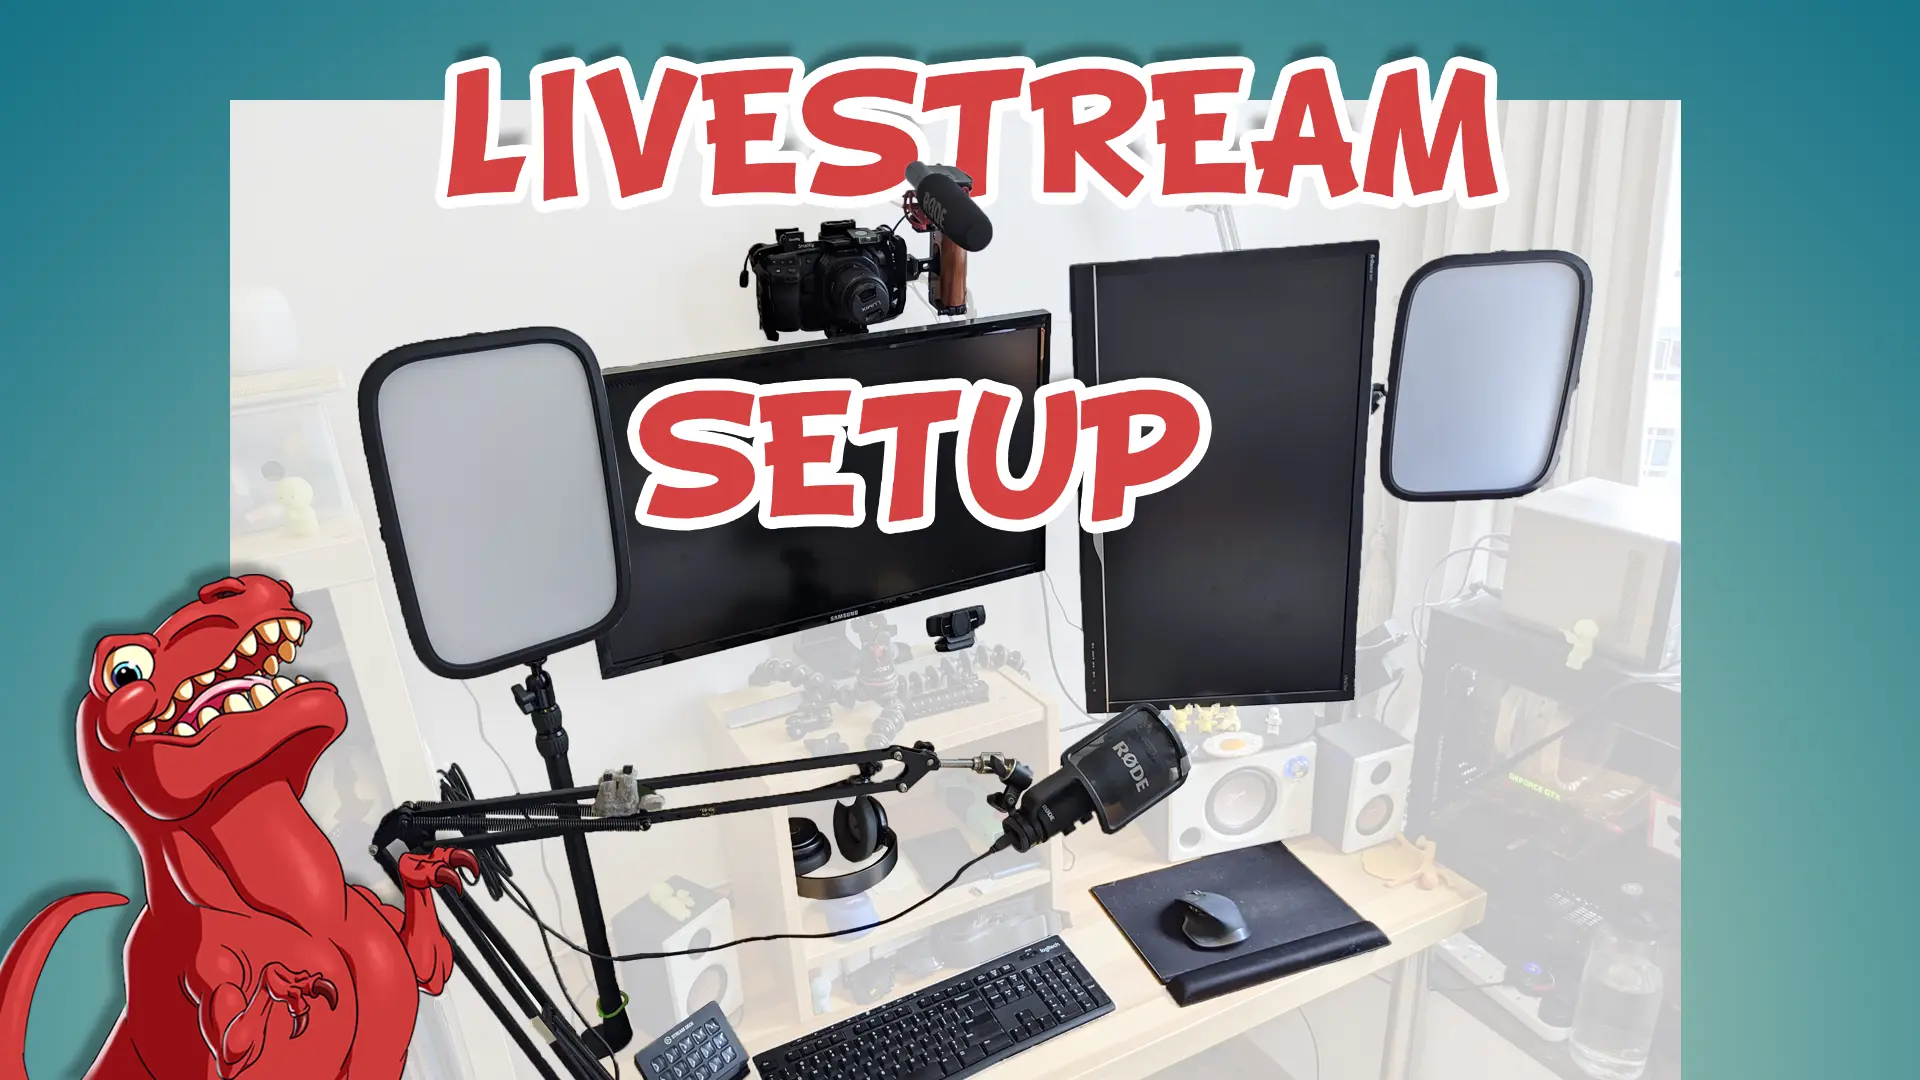
Livestream Setup & Best Practices Guide
At the start of the pandemic I wrote a Livestream setup and best practices guide in Google Docs. This was to help others learn from
