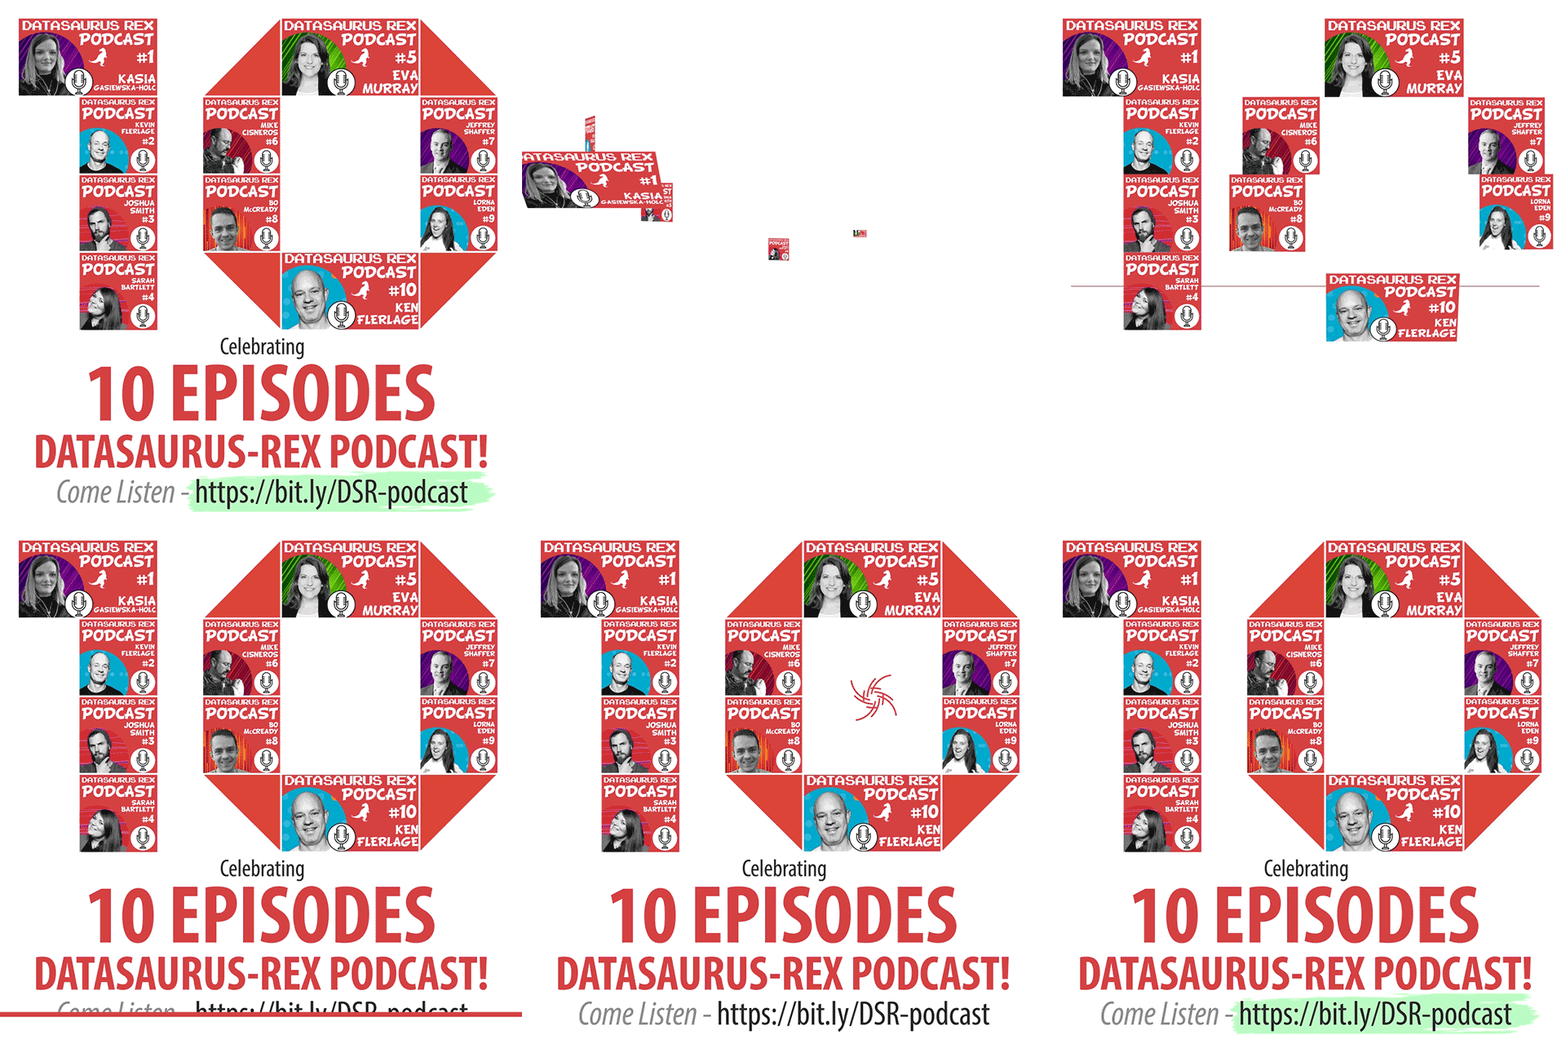
I’ve just hit the 10 episode milestone for the Datasaurus-Rex Podcast and I wanted to share some insights about its future, how I choose the guests and some cool things I’ve learnt by running it so far.
Guest selection criteria:
As the number of episodes and guests increases, I want to be fully transparent on the 3 main criteria I use to select who comes on the podcast:
- The guest creates a high-quality data visualization they have shared publicly
- The data viz is interesting enough that the audience could learn something by better understanding its creation
- The guest is comfortable discussing their work over video conference and being recorded
We’ve had really good diversity so far, and I hope to keep that up – so if you know anyone who meets the criteria, please have them get in touch!
11 Things I’ve learnt from running the podcast:
1. Audio podcasts are more popular that video podcasts
- Despite the podcast being about data viz and us looking at a guests content, I started off with it just being for YouTube.
- However, there was a huge demand for an audio version immediately from people. I’m already recording the audio for my videos, so it wasn’t much work to create an audio version at the same time and host it on all popular podcast services.
- The audio listener numbers are far far higher than the YouTube ones, which is great as it means my guests can reach even more people. Plus it reinforces the notion that you should always listen to the user – or let the user listen in my case! :)
2. The data viz community is awesome and incredibly generous
- Every guest so far has shown a really positive trend that is endemic to the wider data viz community; they do not hoard their knowledge or skills, but actively share and use them to help others.
- This can be in the shape of making their data vizzes available for download, writing comprehensive blog posts, making how-to videos, answering questions on Twitter or making data vizzes for charities and good causes.
- No one pays them to spend time doing this; they do it because they care and want to help others and the community grow
3. It’s never too late to start
- Many of the guests that have been producing great work have only been doing it for a year or two – like Kevin Flerlage, he started using Tableau in 2018 and is already making amazing work and pushing the boundaries of the tool.
- So you don’t have to be creating data vizzes for 5+ years to get good; just dive in, apply some creativity & best practices and you’re away!
4. Don’t hate on the pie chart
- 10/10 guests did not completely write off the pie chart. They definitely agree it’s uses are quite limited, and there are often far better charts to choose from, but they also advocate for not blindly dismissing an tool in your toolkit.
- Joshua Smith and Jeffrey Shaffer cite a great example they spotted in an art gallery where a pie chart is the best option to convey the US military budget vs other countries combined.
5. Get involved with the data viz community
- A lot of the guests talked about how they have benefited from engaging with the data viz community.
- The networks they’ve made have helped push and grow their skills and knowledge a great deal, and ideas can bounce around and be iterated upon that helps everyone e.g. the evolution of the Sankey diagram from the back and forth between Jeffrey Shaffer, Chris Love and Olivier Catherine
- So this is another reason for you to get involved with the data viz community too!
6. There are so many different resources out there to help
- When asked, the guests always cite impressive lists of great data viz content that exists out there. No matter preference, there is going to be a medium to suit you e.g. blogs, mailing lists, podcasts, YouTube channels, Twitter follows, RSS feeds etc.
- I will collate all of the resources they’ve referenced and share those soon, so be sure to follow us to see when that is made.
7. Data is everywhere
Each of the guests tackled widely different data sets, which they either found, cleaned up or made themselves – the type data can’t restrict what you can make, which leads onto the next insight…
8. Your imagination is your only limitation
- Each of the data vizzes we’ve covered have been very different from one another: we’ve seen animated backgrounds, drunk simulator Easter eggs hidden inside a viz, gamified surveys, embedded photo galleries and comic book themed vizzes.
- There is no ‘standard’ data viz format for you to work towards. If you’re comfortable using the tools to execute what you think up, the only limit to what you can make is your imagination.
9. It’s ok to fail and create something terrible
- This is part of many of the guests creative processes and their path to learning.
- None of them envisioned and created their awesome data vizzes perfectly straight away. There were iterations built upon failed approaches, fuelled by learning what doesn’t work to discover what does work.
- So be creative and don’t fear making bad stuff whilst building your data viz. Embracing failure is the secret to many of these great data visualizers successes!
10. More than one approach
- The guests also gave very different answers as to how they approached the construction of their data vizzes.
- Some started by sketching on paper, others build straight within the data viz tool, others mock the layouts in PowerPoint.
- There is no ‘correct’ way to design a good dashboard, just do whatever feels natural to you.
11. Data viz community celebrities are human
- When we see the great work people come up with online, it’s easy to put them on a pedestal and think we can never achieve the same great heights as them.
- Excuses tend to form in our minds; “They’ve been doing this for 5+ years!”, “They studied the right mix of courses at school/university” or “They are part of an exclusive data viz club that helps each other”.
- But after speaking to each of my guests, it was super humbling to know they’re just like you and me. They simply have a passion for data viz that has pushed them to keep practising, trying new things and to constantly improve – which we can all attain if we apply ourselves.
- They are also all really nice and decent people, who are super approachable.
I hope following the Datasaurus-Rex Podcast can provide you with these insights and many more to come. Remember, if you like a guest or their work, they’re human just like you and me, so don’t be afraid to reach out to them online. You’ll be surprised how supportive and helpful they can be, which helps the data viz community grow stronger and stronger.
