Harry Potter Actions Visualisation

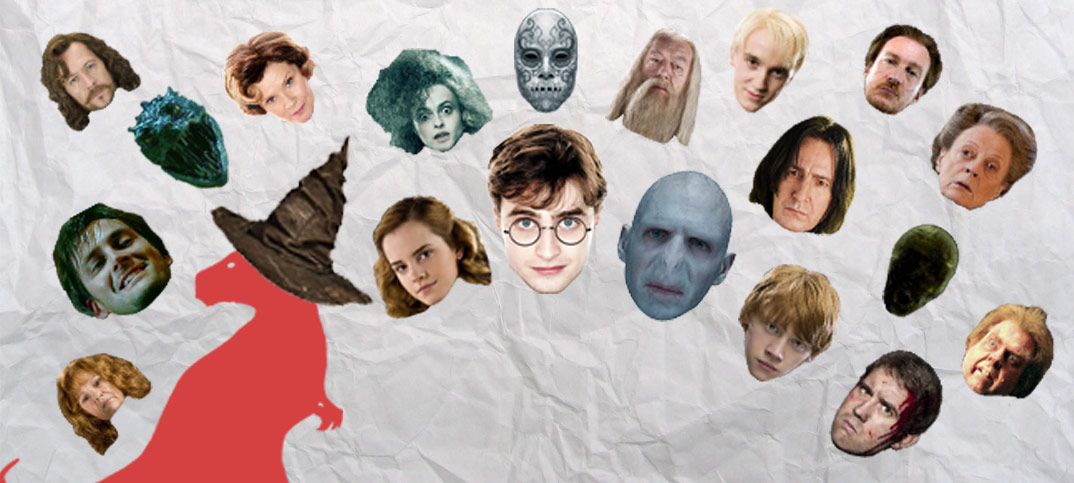
After seeing a post from Tableau’s Jewel Loree about an interesting Harry Potter data source, I couldn’t help but try and visualise it! The data revolves around agentive actions by each character e.g. someone doing something to someone else. The full details of the data collection methodology can be found on Reddit user /u/mrlegilimens post.

I’ll be doing a follow up analysis post soon, but play around with the interactive viz below and see what insights you can find and let me know.

Bonus gif:
Potter paper gif

Facebook Twitter Email Newsletter G+ Youtube LinkedIn

Share:

Leave a Reply

Your email address will not be published. Required fields are marked *

Table of Contents

Social Media:

Most Popular:

Related Posts

Datasaurus

Join the mailing list

Sign up to The Rawr newsletter to stay up to date on new content from the site and YouTube channel. 

Datasaurus

Join the mailing list

Sign up to The Rawr newsletter to stay up to date on new content from the site and YouTube channel.