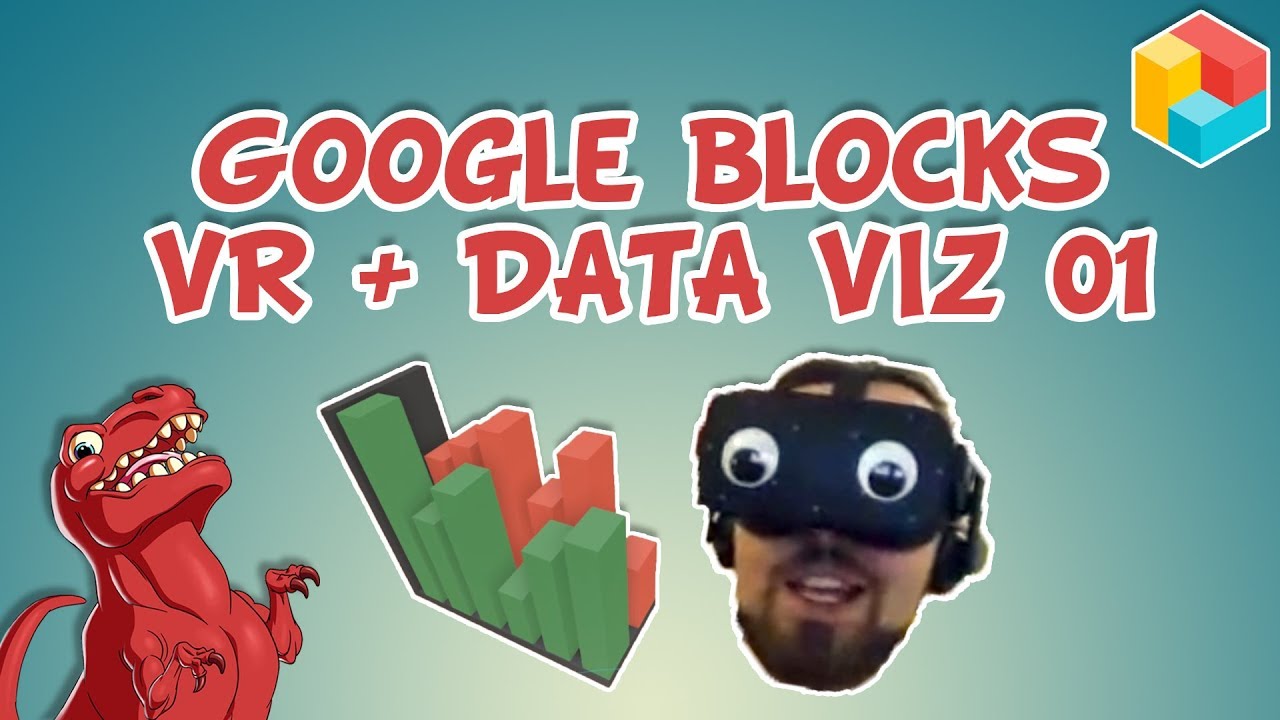
I recently purchased an Oculus Rift, a virtual reality (VR) headset, with the purpose to experiment how this technology can be used in data visualisation and data driven story telling. Not in a gimmicky “let’s jump on the VR bandwagon” way, but more to find useful and innovative ways to enhance data visualisation and story telling.
To do this I’ve been learning two pieces of VR software from Google and recording my journey:
- Google Blocks
- An geometric shape builder
- Tilt brush
- A more natural painting simulator in 3D
You can see my first steps in using the product in the video above, where I experiment making a 3D bar chart (to highlight the fact you should never make them!), and the one below where I make my own Datasaurus-Rex logo:
This software has the added benefit of embedding its outputs onto web pages, where the user can view and interact with the 3D images in their browser:
If you have any ideas, software recommendations, feedback etc, I’m all ears. Watch this space as I’ll start making data driven VR stories once I’m comfortable with the tech.
