Everyone will manage a project at some stage in their lives. It could be at work (launching a product), at school (organizing an event) or at home (renovations). The need to break a big task into smaller tasks, work out when each one will start and end, then manage each one to completion is critical to a project’s success.
Being able to visualize these tasks goes a long way in helping a project manager succeed; by keeping on top of and managing everything well. A Gantt chat is commonly used to visualize this project schedule data. This visualization has benefits such as being able to provide everyone with progress updates at a glance and helping the project manager identifying critical paths.
The Problem
The main problems with people creating and maintaining these Gantt charts usually falls into two main groups:
- Too expensive or hard – Project management software is prohibitively expensive and/or complicated to use
- Too time consuming – Most spreadsheet based solutions are incredibly fiddly and time consuming to set up and maintain – eating away at any benefits or time savings they create
After years of searching for my own free spreadsheet based solution, I was inspired by a post from Trevor Fox who used the Sparkline function in Google Sheets to create Gantt charts.
The Solution
Building on top of this, I have created my own template with some quality and easy of use enhancements, which I’m sharing with you all here!
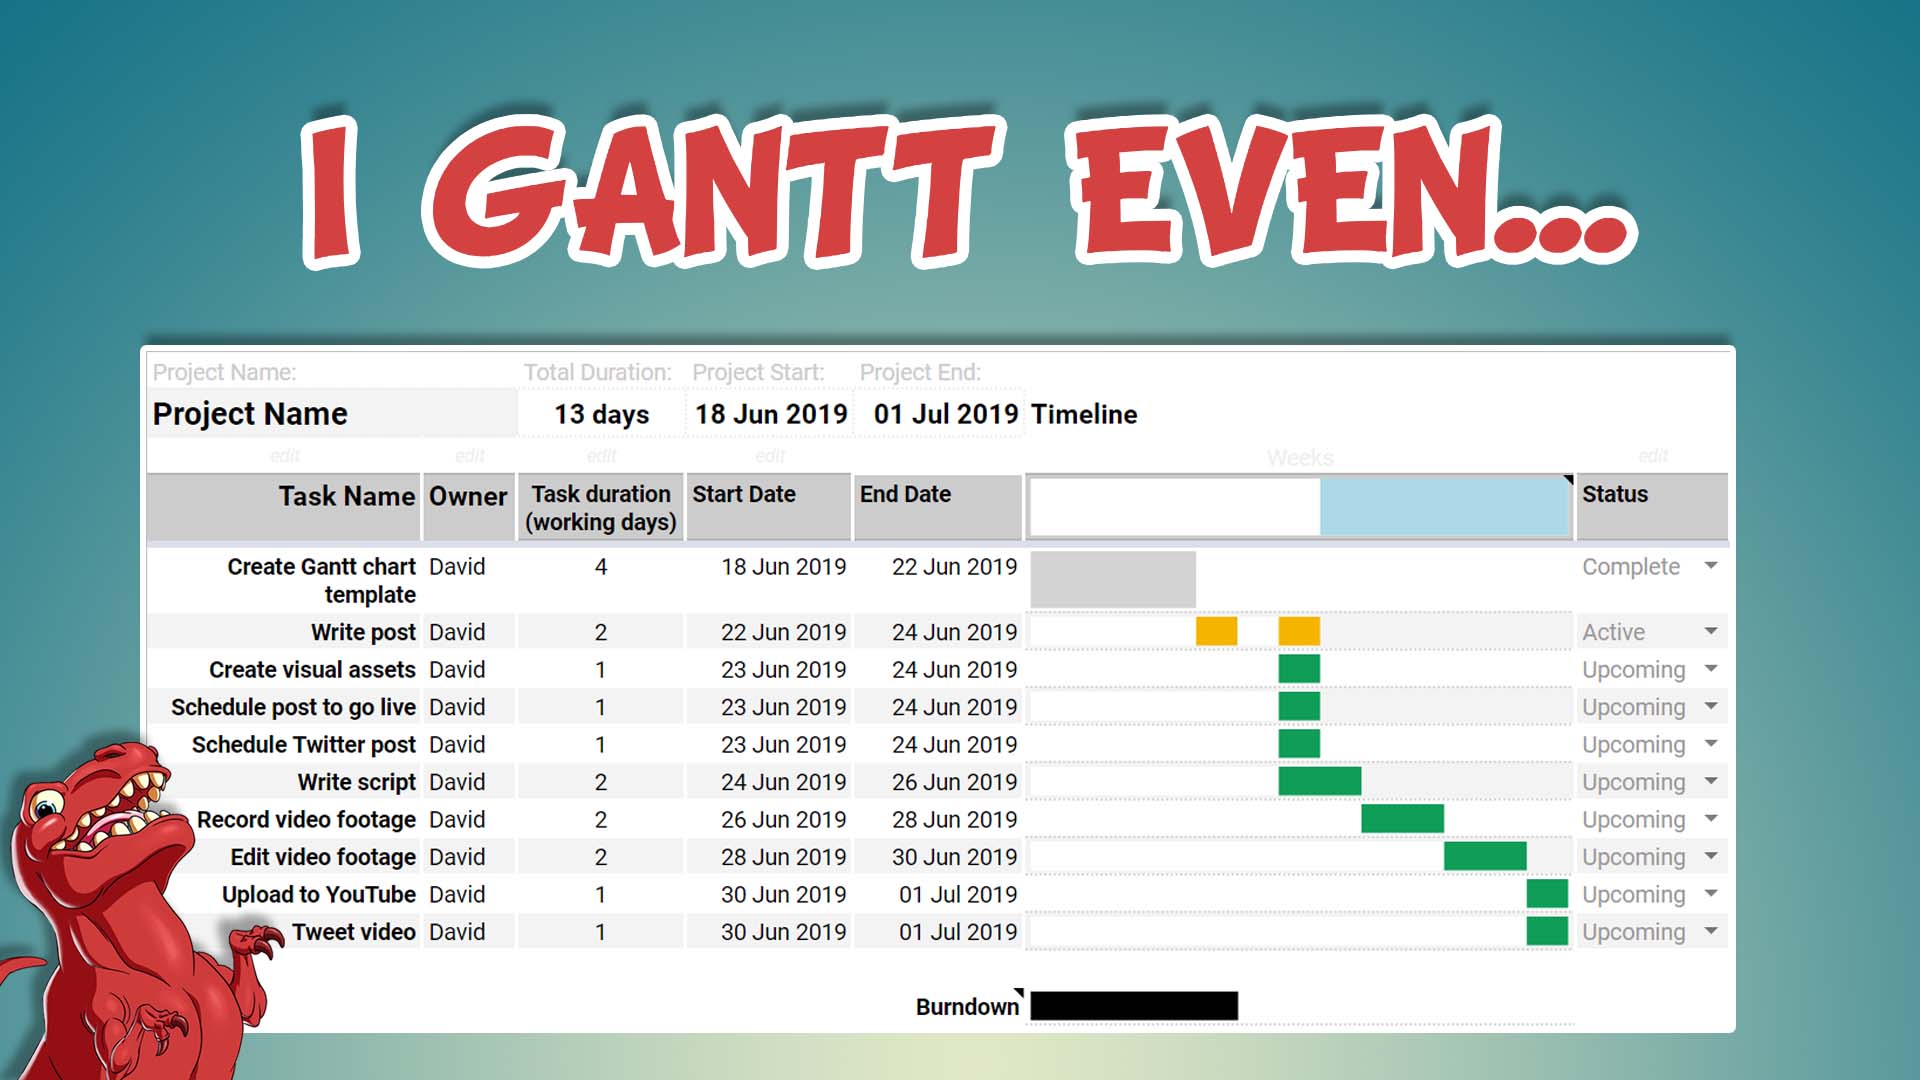
It’s designed to be super easy to use and update – all you need to focus on is the editing of these task details per row:
- Task Name: What is the name of each task?
- Task Duration: How many days will it take to complete each one?
- Start Date: What date do they start on?
- Status: Are they in progress or been completed?
About The Template
With these fundamentals in mind, here are some other things to consider to get the most out of this template:
- A white vertical line will indicate today’s date in the Gantt chartGreat to seeing where you are at in relation to the overall project and if any Tasks need to be started soon.
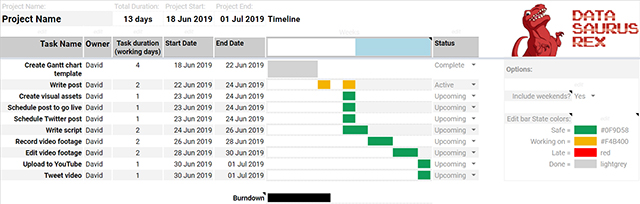
- The bars of the chart dynamically change colorThese are based on the State of each task; Safe, Working on, Late and Done – these are different to a Tasks Statuse.g. if the tasks Status is Upcoming, and it’s start date is in the past, the bar will turn red as it’s State is Late – this draws your attention to a task that should have started by now
- You can change these State colors in the Options section of the Gantt Chart
- The end date equations skip weekends by defaultThat is why you’ll see some tasks bars look longer on the Gantt chart than what you might expect
- You can include weekends by using the dropdown menu in the Options section of the Gantt Chart
- You can link duration and start date cell values to other cell values, to automate task dependenciese.g. if one task can only start when another task finishes, simply make it’s start date cell equal the end date cell of the previous task
- So if the previous task gets delayed, it will automatically push back the following task
- You can add more rowsThe template actually has 100 task rows, but 75 are hidden by default
- Click on the + symbol next to the row numbers to expand – you might get a warning message, but you can ignore this
- Fill in the extra Task row details and hide the rows you don’t need
Now you know how to use it, make a copy of this Sheet and use it for your next project! I hope this simple and easy to use Gantt Chart Google Sheets template helps you out with your next project. If it does help you or if you have feature requests, get in touch here.


