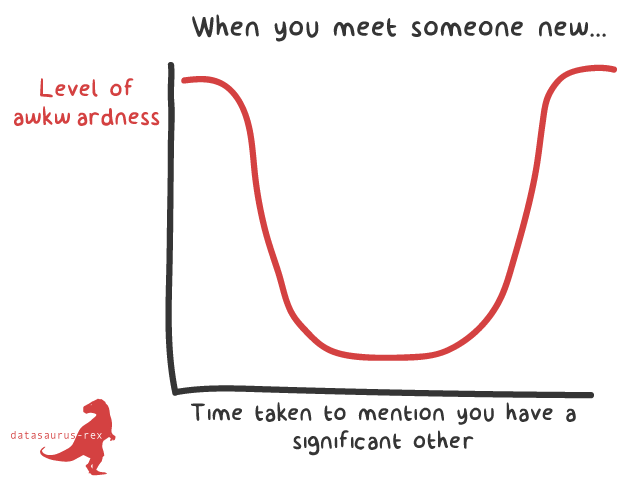
I’m trying out a new section for the site called Universal Truths; by combining my love of data visualizations and attempts at humor. It will primarily involve me trying to graph up situations we can all relate to like the one above.
More famous sites like SMBC and XKCD do this already, but I want to throw my hat into the ring. In honour of them, I’ve set myself the task of adding hover text to each chart like they do :)
It’s actually quite a fun challenge to come up with the ideas and create them, as you have to take a considered approach to how people will understand and infer the humor from your charts.
So check back often as I’ll be adding these at a frequent rate, and let me know if you have any ideas you’d like to to turn into a graph here.







2 Responses
i never thought it would be relevant or useful enough to share but here it is: https://public.tableau.com/views/HandVizzin/UselessCase?:embed=y&:display_count=yes&:showTabs=y
awesome new project, looking forward to more universal truths
Haha, that is awesome! Love the creative use of Tableau and the chart itself. Thanks for sharing.