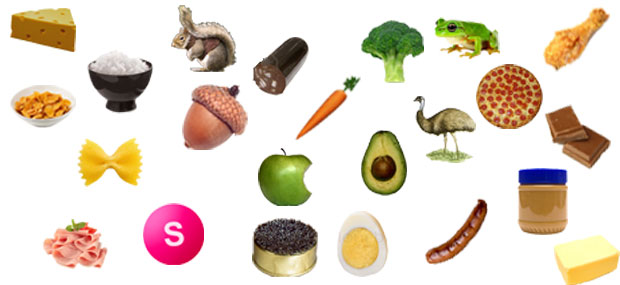
Ever wanted to know how much protein is in squirrel, how much fat is in caviar or how much water makes up frogs legs? Well now you can in my Nutrionanlysis tool.
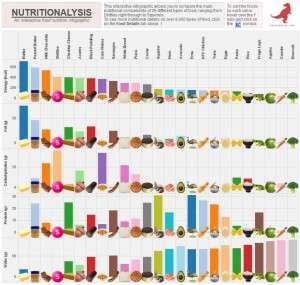
The first tab (click here) allows you to sort and compare 25 different foods, and draw some interesting insights from them. I’ll put together some analysis in a follow up post, but its safe to say hill billies might not be so dumb for wanting to eat squirrel meat…
The second tab (click here) allows you to see the 8,400+ types of food in the USDA’s database (United States Department of Agriculture) in detail. You simply search for the food you want in the top left hand corner, or select the one you want in the drop down menu.
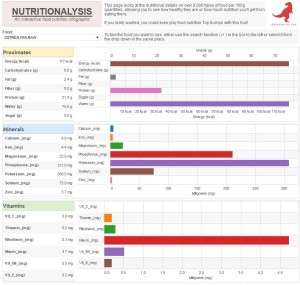
Bear in mind that you are visualising over 8,400 rows of data on the fly in your web browser. Most traditional methods for doing this would easily crash your web browser or provide extremely basic outputs.
This is the power of Tableau Public when put into the hands of someone who knows how to use it and visualise data. They just performed an update to handle 1,000,000 rows, so I look forward to what I can create with that.
Have you spotted anything interesting using the tool or have some feedback for its enhancement? Let me know on the Official Datasaurus-Rex Facebook Page.


